My Account
Table 1. Planting dates and comparative relative maturity of hybrids planted at dry down study locations in 2021.
Planting Date |
Hybrid Comparative Relative Maturity |
||||||||
88 |
91 |
92 |
93 |
94 |
95 |
96 |
98 |
100 |
|
Number of hybrids |
|||||||||
May 3 |
1 |
|
1 |
1 |
1 |
1 |
1 |
|
|
May 13 |
1 |
|
|
1 |
1 |
1 |
1 |
1 |
|
April 29 |
|
1 |
1 |
1 |
1 |
1 |
|
|
1 |
May 16 |
|
1 |
1 |
1 |
|
1 |
|
|
|
May 16 |
|
1 |
1 |
1 |
1 |
1 |
1 |
1 |
|
May 17 |
|
1 |
1 |
1 |
|
1 |
1 |
1 |
|
May 20 |
|
1 |
1 |
1 |
|
1 |
1 |
1 |
|
May 7 |
|
|
1 |
1 |
1 |
1 |
|
|
|
May 10 |
|
|
|
1 |
1 |
1 |
|
|
|
May 15 |
|
|
|
1 |
|
1 |
|
|
|
May 12 |
|
|
|
|
1 |
1 |
1 |
2 |
|
Accumulated growing degree units (GDUs) for each trial location were estimated using the GDU calculator.
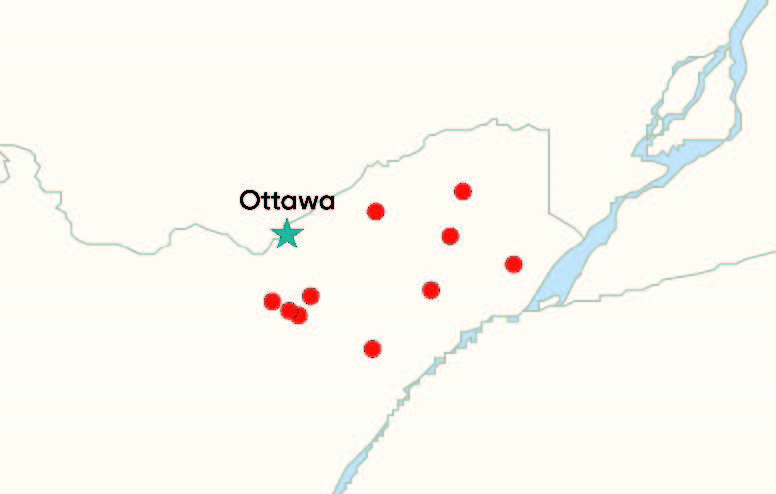
Figure 1. Dry down study locations in Eastern Ontario in 2021.
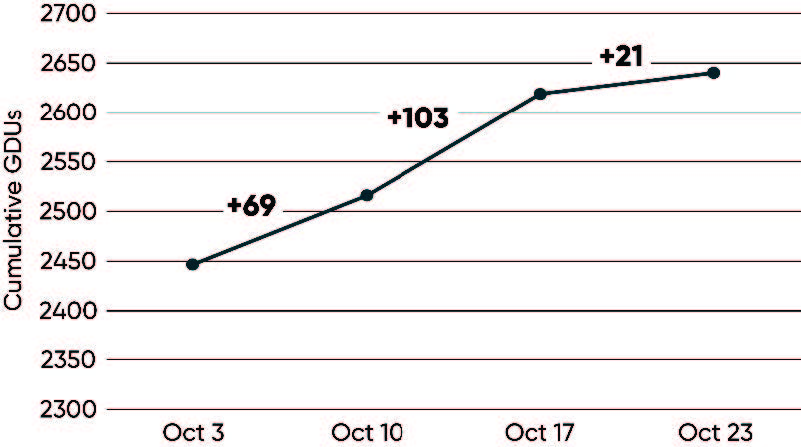
Figure 2. Average cumulative GDUs since planting across trial locations on the four moisture sampling dates.
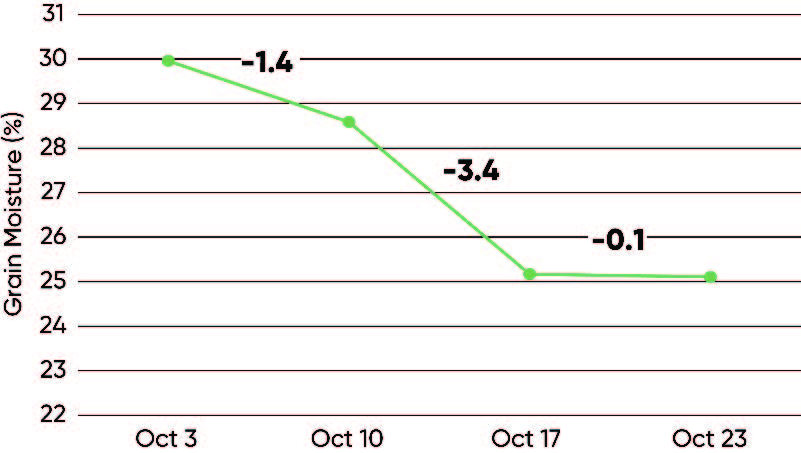
Figure 3. Average grain moisture across all trial locations and hybrids on the four moisture sampling dates.
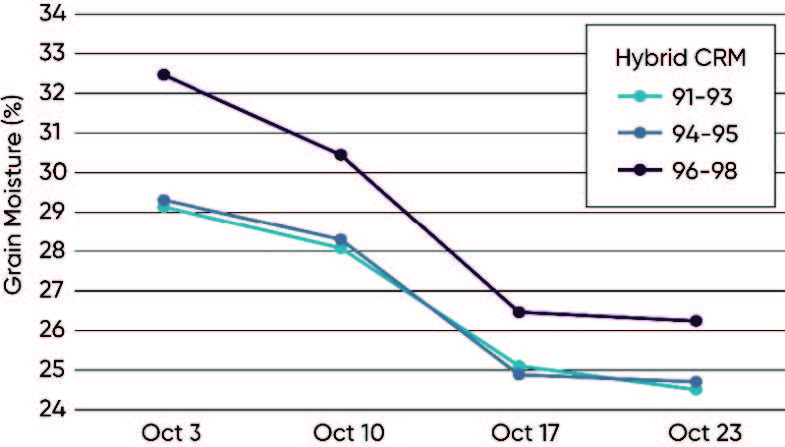
Figure 4. Average grain moisture by hybrid comparative relative maturity (CRM) on the four moisture sampling dates.
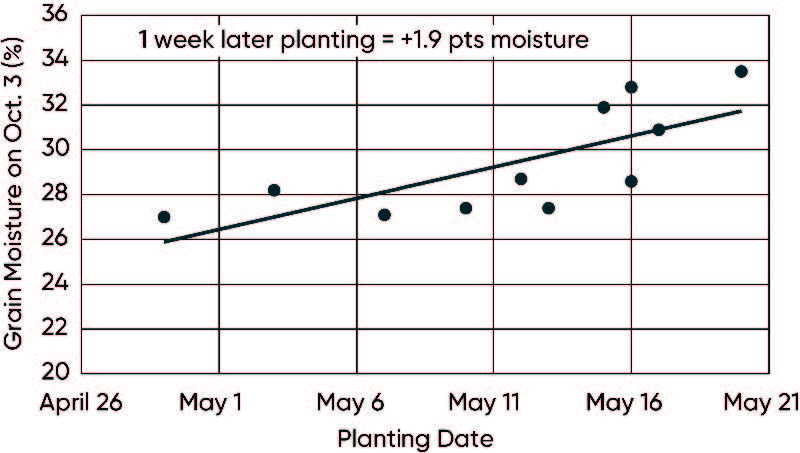
Figure 5. Effect of planting date on average moisture of 95 CRM hybrids measured on October 3 across 11 locations.
Hermans, P., and C. Olbach. 2021. Corn maturity and dry down in Ontario. Pioneer Agronomy Research Update. Vol. 11 No. 1.
Thank you to the following Pioneer Sales Agents for their participation in this study:
Martin Besner, Carleton Farm Seed Ltd, Fife Agronomics Ltd, Leeder AgriservicesInc, RumkeAgricultural Services, Rebecca Spuehler, SerAgriInc, and Charles Wert Ag Products Inc.
Authors:
Liam Bracken, Paul Hermans, Tuesday Kristiansen, and Mark Jeschke
December 2021
The foregoing is provided for informational use only. Please contact your Pioneer sales professional for information and suggestions specific to your operation. 2021 data are based on average of all comparisons made in 11 locations through October 23, 2021. Multi-year and multi-location is a better predictor of future performance. Do not use these or any other data from a limited number of trials as a significant factor in product selection. Product responses are variable and subject to a variety of environmental, disease, and pest pressures. Individual results may vary. RU211221