Rationale & Objectives
- Greater genetic yield potential, combined with physiological changes and improved management practices, has lead to annual increases in the average national soybean yield (0.4 bu/acre/year) and greater frequency of growers achieving yields greater than 75 bu/acre throughout the Midwest.
- Phosphorus and potassium fertilization is likely the most critical annual fertility decision growers make. Fertility programs should not limit soybean yield, while still being environmentally sound.
- Therefore, precise knowledge of soybean P2O5 and K2O requirements (specifically crop removal) across a wide yield range is critical for environmentally and economically sustainable fertility programs, while in-season P2O5 and K2O utilization is beneficial for various management decisions.
Study Description
- Test Environments: 2 years at 3 locations with non-limiting fertility levels, resulting in 6 different testing environments.
- Soybean Varieties: 8 Pioneer® brand soybean varieties (RM 1.0-2.5)
- Planting Dates: Early and late May
- Plant Sampling: Collected at the V4, R1, R4, R5.5, R6.5, and R8 growth stages and partitioned into the following parts:
Stems Petioles Leaves Pods Seeds Fallen Leaves/Petioles - Nutrients Quantified: Phosphorus and potassium, presented in fertilizer equivalents (P2O5 and K2O)
- 6,672 tissue samples analyzed that span a yield range of 40 to >100 bu/acre.

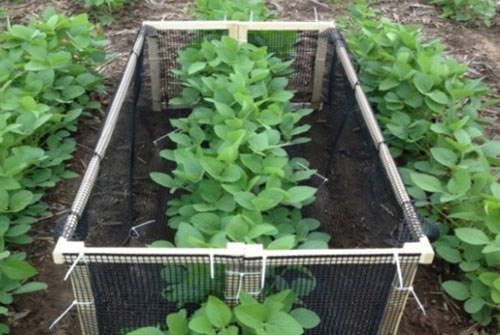
Catch container used to collect all fallen leaves and petioles throughout the growing season from each plot.
Nutrient Uptake
P2O5 and K2O Uptake

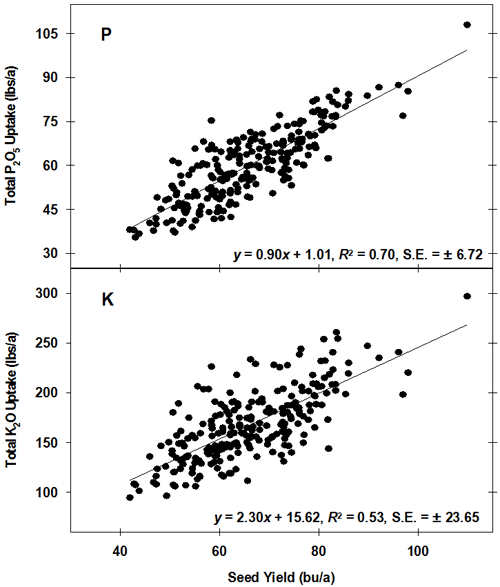
Figure 1. Total whole plant P2O5 and K2O uptake at growth stage R8 (full maturity) across all environments and varieties.

Figure 1. Total whole plant P2O5 and K2O uptake at growth stage R8 (full maturity) across all environments and varieties.
- Across all environments and varieties, the soybean plant took up an average of 0.9 lbs of P2O5/bu/acre. Potassium uptake was more than double this at 2.3 lbs of K2O/bu/acre. Therefore, an 80 bu/acre soybean crop accumulated 73 and 200 lbs of P2O5 and K2O, respectively, by R8 (Figure 1).
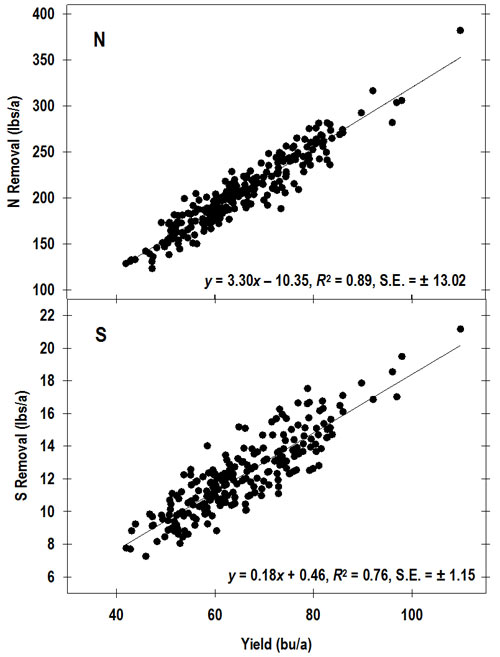
- More variability existed in the relationships between P2O5 and K2O uptake and yield than the relationship between N uptake and yield (R2 = 0.80). This was due to the fact that both P2O5 and K2O uptake were greatly affected by the environment, with K2O experiencing the greatest variability in uptake associated with environmental differences and therefore lowest R2 value.
- As displayed in Figure 3, 90% of total K2O uptake is accumulated by R5 (beginning seed fill) but seeds/m2 and seed size are far from being determined. This lack of overlap and the fact that soybean is a luxury K2O consumer certainly contribute to the moderate relationship between total K2O uptake and seed yield (R2 = 0.53) (Figure 1).
Nutrient Uptake Rate
P2O5 and K2O Uptake Rate

Figure 2. P2O5 and K2O uptake rate through the growing season for a 66 bu/acre soybean crop. Duration of peak uptake period is represented by a horizontal black line.

Figure 1. Total whole plant P2O5 and K2O uptake at growth stage R8 (full maturity) across all environments and varieties.
- The potassium uptake rate accelerated quickly after V2 to a peak rate of 4 lbs K2O/acre/day at R2 and then sharply decelerated through R6 (Figure 2).
- Phosphorus displayed a more gradual build and decline before and after the peak uptake rate (1 lb P2O5/acre/day), which occurred at R3 (Figure 2).
Nutrient Partitioning & Utilization
P2O5 & K2O Partitioning & Utilization

Figure 3. P2O5 and K2O uptake, partitioning, and remobilization through the growing season for a 66 bu/acre soybean crop.
- Relative uptake prior to R1 was minimal for P2O5 (13%), but greater than 25% for K2O. Leaves and stems were large storage organs for P2O5, while K2O was more equally distributed to all plant parts.
- Seed K accumulation relied more heavily on vegetative remobilization compared to P2O5 (76 vs. 52%), yet the nutrient harvest index (HI) was much higher for P2O5 (81%) than K2O (49%) and was similar to the N HI (83%) at the same yield level (Figure 3).
- The large K2O uptake requirement (2.3 lbs K2O/bu/acre) and low K2O HI makes stover removal a major pathway for K2O removal and soil K2O depletion if not replaced with fertilizer.
Nutrient Removal with the Grain
P2O5 and K2O Removal with the Grain

Figure 4. Total P2O5 and K2O removal with the seed at growth stage R8 across all environments and varieties.

Figure 4. Layout of quadrats within two 6 by 8-ft treatment plots.
- Total P2O5 (0.74 lbs./bu/acre) and K2O (1.17 lbs/bu/acre) removal with the grain was consistent across all varieties and environments. Therefore, an 80 bu/acre soybean crop removed 59 and 98 lbs of P2O5 and K2O, respectively (Figure 4).
- In comparison a 200 bu/acre corn crop would remove similar amounts of P2O5, but only half the amount of K2O.
Conclusions
- Soybean K2O uptake varied considerably by environment and was utilized and removed with the grain in greater quantities than P2O5.
- Moreover, the K2O HI was much less than that of P2O5, making stover harvest a large avenue for K2O removal.
- Peak uptake rates occurred at R2 and R3 for K2O and P2O5, respectively, with K2O partitioned more equally between all plant parts compared to P2O5, which accrued mainly in leaves and stems.
test
- Test Environments: 2 years at 3 locations with non-limiting fertility levels, resulting in 6 different testing environments.
- Soybean Varieties: 8 Pioneer® brand soybean varieties (RM 1.0-2.5)
- Planting Dates: Early and late May
- Plant Sampling: Collected at the V4, R1, R4, R5.5, R6.5, and R8 growth stages and partitioned into the following parts:
Stems Petioles Leaves Pods Seeds Fallen Leaves/Petioles - Nutrients Quantified: Phosphorus and potassium, presented in fertilizer equivalents (P2O5 and K2O)
- 6,672 tissue samples analyzed that span a yield range of 40 to >100 bu/acre.

The foregoing is provided for informational use only. Please contact your Pioneer sales professional for information and suggestions specific to your operation. Data are based on average of all comparisons made in six environments from 2014-2015. Multi-year and multi-location is a better predictor of future performance. Do not use these or any other data from a limited number of trials as a significant factor in product selection. Product responses are variable and subject to a variety of environmental, disease, and pest pressures. Individual results may vary.