Summary
- Optimal soybean seeding rates are affected by multiple factors with the inherent productivity of the environment being critical.
- While variable rate seeding (VRS) technology has been rapidly adopted by growers for corn, it has lagged for soybean production.
- Recent research shows there is opportunity for growers to better manage their annual soybean seed investment with variable rate seeding technology.
- Soybean VRS strategies should be the inverse of corn – higher seeding rates in areas of lower productivity and lower seeding rates in areas of higher productivity.
- Pioneer Sales Representatives can provide growers with the necessary platform, agronomic science, and technology to successfully develop soybean VRS prescriptions.
Introduction
Soybean seeding rate and its relationship with yield has been intensely studied in major soybean-producing regions across the U.S. by industry, universities, and in grower on-farm trials. The goal of these studies, like that for many agricultural inputs, is to determine an agronomically optimal rate (the minimum level of input required to maximize yield). While many of these studies succeed in identifying optimal soybean seeding rates and quantifying variability between fields, they fail to evaluate the seeding rate response within the field’s own inherent variability (De Bruin and Pedersen, 2008; Epler and Staggenborg, 2008; Gaspar et al., 2017; Holshouser and Whittaker, 2002).
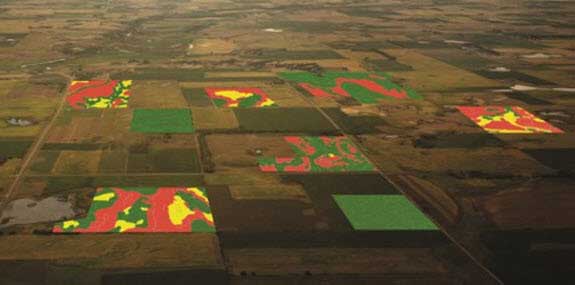
The adoption of variable rate drives on planters and digital tools over the past decade now allow growers to identify and better manage the spatial and temporal variability across a field to increase productivity and return on investment (ROI). This Crop Insights will discuss the potential to adapt this technology to optimize soybean seeding rates at a more granular level.
Past and Present Soybean Seeding Rates
Historically soybeans were often seeded at rates well over 200,000 seeds/acre. However, since the turn of the current century, on-farm seeding rates have steadily declined by roughly 2,000 seeds/acre/year to an average of 152,000 seeds/acre in 2017. There are numerous reasons for this decline. More accurate planting equipment is now common after many growers have switched from drills to row crop planters (>80%) as the number of crops in rotation has decreased (Jeschke and Lutt, 2016). Seed treatment adoption has reached >80% allowing for more successful stand establishment (Gaspar et al., 2015). Seed quality and vigor has dramatically improved with adoption of better seed handling and cleaning equipment (Shelar, 2008). Furthermore, the adoption of soybean varieties with herbicide resistance traits has shifted the focus away from cultural control tactics, such as higher seeding rates for weed management (Bertram and Pedersen, 2004).
The aforementioned factors have caused growers to question if a further decrease in soybean seeding rates is warranted. Some studies have determined that 100,000 plants/acre at harvest time are required to maximize light interception and thus yield (Gaspar and Conley, 2015; Lee et al., 2008) while other studies have shown economically optimal seeding rates ranging from 95,000 to 130,000 seeds/acre (Gaspar et al., 2017). However, these studies are typically conducted on one soil type that is uniform, well drained, and highly productive, totaling less than one acre in size. This is done in an effort to minimize environmental effects and variability. The same has typically been the case where on-farm trials use strips across an entire field length, which moderates the impact of high and low productivity areas within that strip. In comparison to these studies, others have suggested seeding rates as high as 243,000 plants/acre are needed in more stressful environments (Holshouser and Whittaker, 2002). Thus, there is clearly a wide range of agronomically and economically optimal seeding rates and plant stands that depend on seed costs, grain prices, seed treatment use, and most importantly, the inherent productivity of the environment.
Soybean VRS Future
With the rapid adoption of geo-spatial tools, such as yield maps and variable rate planter drives, growers are better able to manage their annual seed investment by spatially adjusting seeding rates based upon the productivity of the environment and its underlying environmental factors (Smidt et al., 2016). This is applicable at the between-field and within-field levels. Variable rate seeding (VRS) technology has been rapidly adopted for corn production with early research taking place in the late 1990s (Bullock et al., 1998). Research and adoption has not been as intense for soybeans, but recent research from Gaspar et al. (2018) demonstrates that there are significant opportunities in VRS for soybeans. Therefore, we will incorporate the results of Gaspar et al., 2018 and provide guidance for successful soybean VRS implementation to manage the variability present in every field.
Agronomically Optimal Seeding Rates
Growers have typically established a seeding rate that works across their farming operation based upon experience and regional recommendations to maximize yield and agronomic benefits, such as stand establishment, weed control, and disease management. This rate can be considered the agronomically optimal seeding rate (AOSR) for all yield levels (i.e., average or local standard seeding rate). Many have speculated that the philosophy behind soybean VRS should be the inverse of corn VRS, suggesting that soybean seeding rates should be increased in areas of lower productivity and decreased in areas of higher productivity compared to the “average” seeding rate. Many anecdotal reports have confirmed this philosophy as a method to increase yield in lower productivity areas as well as maintain yield and reduce seed costs in higher productivity areas, resulting in greater whole field yield and profit. However, there has yet to be a comprehensive study testing this philosophy until the recent publication of Gaspar et al. (2018).
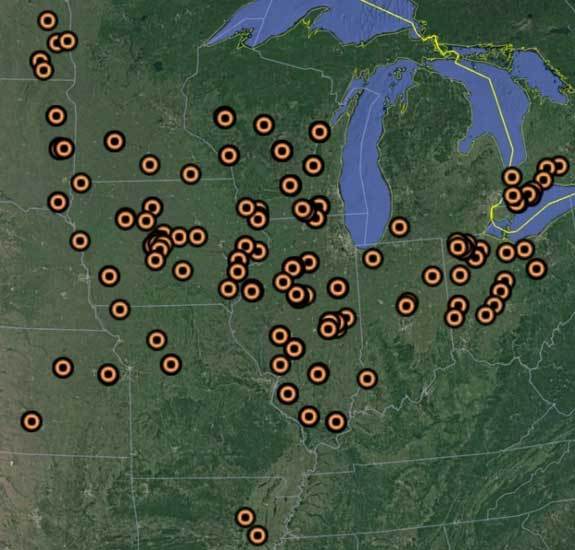
Figure 1. Location of soybean seeding rate studies from Gaspar et al. (2018).
In this study, soybean seeding rate studies from across the U.S. and Canada were compiled from over 200 environments spanning multiple years and totaling 21,000 data points, which represents the largest replicated soybean seeding rate data set to date (Figure 1).
The results of Gaspar et al. (2018) confirmed that soybean VRS strategies should increase seeding rates in areas of lower productivity and decrease seeding rates in areas of higher productivity relative to the average yield level and seeding rate of an individual field (Table 1). In addition, the relative increase (+19%) in seeding rate to reach the AOSR within lower yield levels is approximately 3x the decrease (-6%) in seeding rate to reach the AOSR within higher yield levels (Table 1). This trend is even greater in the Northern Corn Belt, where the relative increase in seeding rate is 6x that of the decrease to reach the AOSR of the low and high yield level (+41% in low vs. -8% in high) (data not shown).
This study also quantified the risk associated with decreasing or increasing the seeding rate from the AOSR within each yield level. Table 1 shows that increasing seeding rates beyond the AOSR by 20% resulted in a 56 to 60% chance of increasing yield above the AOSR across yield levels. In comparison, decreasing seeding rates below the AOSR by 20% provided a 65 to 84% chance of yielding less than the AOSR with greatest risk in high yield levels. Thus, risk-averse growers may choose to increase seeding rates slightly above the AOSR to ensure yield is maximized, while growers who are comfortable with additional risk may choose to decrease seeding rates slightly below the AOSR within each yield level. That being said, all growers should understand that there is considerably more downside risk or potential yield loss with a 20% decrease from the AOSR than upside potential with a 20% increase from the AOSR (Table 1).
Ultimately, exact seeding rates employed on a VRS prescription for an individual field will need to be determined on a case-by-case basis driven by grower experience and regional recommendation but should follow the VRS strategy outlined above by Gaspar et al. (2018). Your Pioneer Sales Representative can assist with this effort and details are discussed later.
Table 1. Agronomically optimal seeding rate (AOSR) relative to the average yield level AOSR and the risk associated with divergence from the AOSR in each yield level.
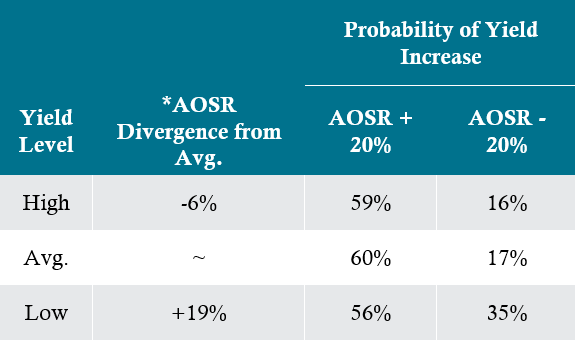
*AOSR divergence from the average represents the % increase or decrease in seeding rate from the average yield level to reach the AOSR of the high or low yield level.
Physiological Drivers of This Strategy
Adequate soybean stand establishment is required for agronomic and economic success. Many growers have adjusted seeding rates based on the theory that stand establishment (early season plant stand ÷ seeding rate) in areas of low productivity is reduced. Therefore, it is reasonable to assume that reduced stand establishment is the driving principal of why seeding rates should be increased in lower productivity areas of the field. However, this is not the case according to Gaspar et al. (2018), who found stand establishment was not affected by yield level, regardless of geographical location in the U.S. Thus, yield level and stand establishment are not connected, and stand establishment is not the driving factor behind the relatively higher seeding rates required in low productivity areas of a field.
Plant attrition is defined as the unexplained plant stand loss from emergence through harvest. Much like that of early season stand establishment, the amount of plant attrition throughout the growing season, and therefore harvest stand, did not differ between yield levels. However, Gaspar et al. (2018) did find that seeding rate affected the amount of plant attrition, in that higher seeding rates experienced greater amounts of plant attrition (data not shown).
Averaged over seeding rates, the effect of plant attrition on final yield is displayed in Figure 2. At the high yield level, plant attrition does not affect yield, while a negative relationship exists for the average and to a greater extent, low yield levels. Therefore, in low yield levels, not only are higher seeding rates required to reach the AOSR, but maintaining this increased plant stand throughout the growing season is critical to maximize yield (Figure 2). The use of seed treatments, appropriate tillage and planting practices, narrow rows, and adequate fertility are all components that can minimize in season plant attrition in areas of lower productivity.
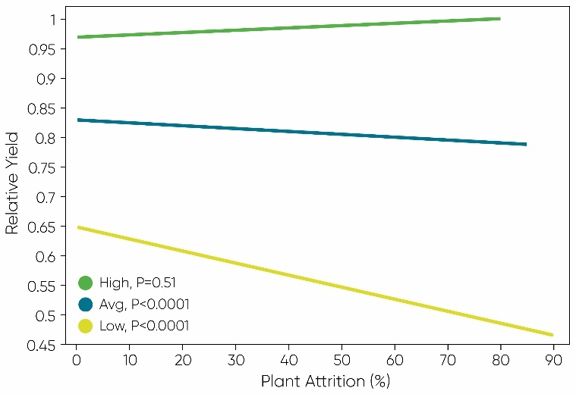
Figure 2. Plant attrition relation to relative yield in three different yield levels.
A key point to remember is that soybean yield is linearly related to light interception, and this relationship is typically more critical in the Northern U.S. versus the Southern U.S. (assuming typical planting dates). Simply put, greater season-long light interception equals greater yield. In highly productive environments, current varieties can maintain yield with slightly reduced plant stands because the individual plant growth rate is not limited, and maximum light interception, and therefore yield, is still achievable. Furthermore, breeding efforts have increased the yield produced per plant, and specifically, this increase is attributed to the branches, not the main stem of the plant (Suhre et al., 2014). This complements lower plant stands by increasing the plant’s compensatory ability where plant stands are lower within highly productive areas (Carpenter and Board, 1997). However, in the inverse direction, breeding efforts have also made current soybean varieties more responsive to higher seeding rates. This complements the increased seeding rate required in areas of lower productivity, where plant growth rate and branching can be limited due to many potential factors, such as precipitation amount, soil water-holding capacity, nutrient supply, rooting depth, etc.
These factors, most commonly limiting in low productivity areas, can challenge the ability of soybean plants to maximize season-long light interception. Increased plant density is therefore required to maximize light interception and yield in these lower yield levels. In the same line, total season-long light interception is typically limited in northern latitudes, and this explains why the increase in seeding rate to reach the AOSR within the low yield level is relatively greater in northern versus southern latitudes (Gaspar et al., 2018). These aforementioned factors all contribute to the true physiological basis driving this soybean VRS strategy.
Conclusions
There is an opportunity for growers to fully utilize current planter technology and better manage their soybean seed investment by implementing VRS technology, particularly in more northern latitudes. Ultimately, the specific seeding rates for the varying levels of productivity across an individual field will be based upon local and regional recommendations, grower risk tolerance, economics, variety characteristics, seed treatment use, and other agronomic factors, but should follow the trend of increasing seeding rates in areas of lower productivity and decreasing seeding rates in areas of higher productivity. Pioneer sales representatives provide the necessary platform, agronomic science, and technology to develop successful soybean VRS prescriptions that consider genetic, environment, and other management components.
References
- Bertram, M.G., and P. Pedersen. 2004. Adjusting management practices using glyphosate-resistant soybean cultivars. Agron. J. 96:462-468.
- Bullock, D.G., D.S. Bullock, E.D. Nafziger, T.A. Doerge, S. R. Paszkiewicz, P.R. Carter, and T.A. Peterson. 1998. Does Variable Rate Seeding of Corn Pay? Agron. J. 90:830-836.
- Carpenter, A.C. and J.E. Board. 1997. Branch yield components controlling soybean yield stability across plant populations. Crop Sci. 37:885-891.
- De Bruin, J.L. and P. Pedersen. 2008. Soybean seed yield response to planting date and seeding rate in the upper Midwest. Agron. J. 100: 696-703.
- Epler, M. and S. Staggenborg. 2008. Soybean yield and yield component response to plant density in narrow row systems. Online. Crop Management doi:10.1094/ CM-2008-0925-01-RS.
- Gaspar, A.P. and S.P. Conley. 2015a. Responses of canopy reflectance, light interception, and soybean seed yield to replanting suboptimal stands. Crop Sci. 15:377-385.
- Gaspar, A.P., D.A. Marburger, S. Mourtzinis, and S.P. Conley. 2015b. Soybean seed yield response to multiple seed treatment components across diverse environments. Agron. J. 106:1955–1962.
- Gaspar, A.P., D.S. Mueller, K.A. Wise, M.I. Chilvers, A.U. Tenuta, and S.P. Conley. 2017. Response of broad-spectrum and target-specific seed treatment and seeding rate on soybean seed yield, profitability, and economic risk. Crop Sci. 56:2251-2262.
- Gaspar, A.P. S. Mourtzinis, D. Kyle, E. Galdi, L.E. Lindsey, H.J. Kandel, P. Schmidt, J. Stanley, J.P. Schmidt., D.S. Mueller, E.D. Nafziger, J. Ross, A.J. Varenhorst, K.A. Wise, I.A. Ciampitti, M.I. Chilvers, A.U. Tenuta, and S.P. Conley. 2018 Soybean Seed Yield, Yield Component, and Plant Attrition Responses to Seeding Rate across Diverse Environments in the US and Canada. Field Crops Res. In review.
- Holshouser, D.L., and J.P. Whittaker. 2002. Plant Population and Row-Spacing Effects on Early Soybean Production Systems in the Mid-Atlantic USA. Agron. J. 94: 603–611.
- Jeschke, M., P. Carter., P. Bax., and R. Schon. 2015. Putting variable-rate seeding to work on your farm. Pioneer Crop Insights 25:14. Jeschke, M. and N. Lutt. 2016. Row width in soybean production. Pioneer Crop Insights 26:12.
- Lee, C.D., D.B. Egli, and D.M. TeKrony. 2008. Soybean response to plant population at early and late planting dates in the Mid-South. Agron. J. 100:971–976.
- Shelar, V.R. 2008. Role of mechanical damage in deterioration of soybean seed quality during storage – a review. Agric. Rev. 29:177-184.
- Smidt, E. R., S. P. Conley, J. Zhu, and F. J. Arriaga. 2016. Identifying field attributes that predict soybean yield using random forest analysis. Agron. J. 108:637-646.
- Suhre, J. J., N. H. Weidenbenner, S. C. Rowntree, E. W. Wilson, S. L. Naeve, S. P. Conley, S. N. Casteel, B. W. Diers, P. D. Esker, J. E. Specht, and V. M. Davis. 2014. Soybean yield partitioning changes revealed by genetic gain and seeding rate interactions. Agron. J. 106:1631-1642.
The foregoing is provided for informational use only. Contact your Pioneer sales professional for information and suggestions specific to your operation. Product performance is variable and subject to any number of environmental, disease, and pest pressures. Individual results may vary.
January 2019