12/13/2020

Assessing Management Decisions at Season’s End: On-Farm Yield Gap Analysis

Something went wrong. Please try again later...

Written by Christopher Parry, Ph.D.1, Jose Rotundo, Ph.D.2, Dan Berning3, and Charlie Messina, Ph.D.4

What is Yield Gap Analysis?

  • A gap analysis is the comparison between the observed farmer’s yield versus the water-limited yield potential.
  • Potential yield is determined by the duration of the growing season, the genotype, and the solar radiation and temperature environment.
  • Water-limited yield potential is the attainable yield for any given amount of available water in the absence of nutrition limitations and pest and/or disease influence.
  • Scientists at Corteva Agriscience have defined the water-limited yield potential of corn in the range 0 to 39 inches of available water that was used by the crop.
  • A critical aspect of the gap analysis is the capability to determine crop water use in order to conduct a retrospective analysis to understand the gap between what was possible (potential) and what was achieved (observed).

How to Close the Yield Gap

To close the gap between observed and potential yields, growers can optimize agronomic management strategies for corn production on individual fields.

Opportunities for closing yield gaps may include:

  • Adjusting seeding rates or plant populations to optimize the hybrid for the expected environment
  • Refining nitrogen placement and timing
  • Selecting the best adapted genotype for the expected environment
  • Changing irrigation timing
  • Managing pests and diseases

Estimating Yield Gaps Based on Evapotranspiration

To analyze yield gap at the end of a season, first calculate an estimate of crop evapotranspiration (ET) to determine potential yield. Then you can compare potential yield to actual yield to identify opportunities for closing the gap.
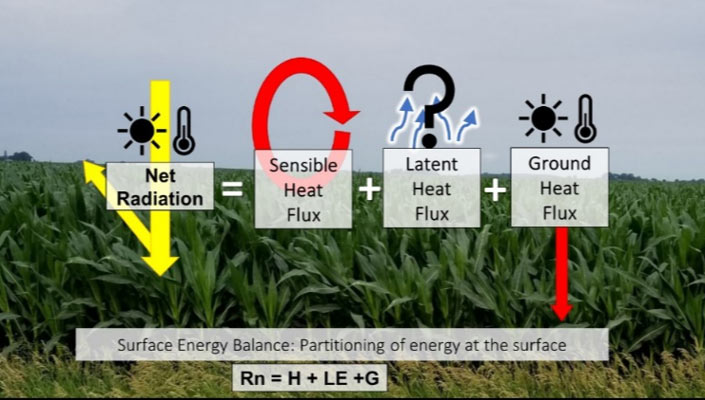
Photo - Surface energy budget over corn..

Figure 1. Surface energy budget over corn.

Evapotranspiration is calculated using the energy balance method (Figure 1). The surface energy balance equation used in this project for the crop-soil surface is written as

Rn = H + λE + G

where Rn is net radiation, H is sensible heat flux, λE is latent heat flux and G is the ground heat flux. 

Rn, the net radiation, is the absorbed solar and thermal energy from the atmosphere and is balanced by sensible (energy exchange from air movement), latent (energy exchange from transpiration/ evaporation), and ground (energy gained or loss during below ground warming or cooling) heat fluxes.

The Rn and G components of the energy budget can be measured or modeled using meteorological variables measured by basic weather stations (windspeed, air temperature, relative humidity, and incoming solar radiation). The H term is calculated by characterizing the surface temperature fluctuations that are measured by an infrared thermometer (IRT) which is a non-contact thermometer (meaning it is not in direct contact with a plant). The λE term is difficult to quantify using basic and inexpensive sensors and is thus calculated as the residual of the energy balance:

λE = Rn - H - G

Evapotranspiration is then calculated by dividing λE by the latent heat of vaporization (λ) to convert the energy into a volume/depth of water loss.

In the 2019 and 2020 seasons, the measurement variables necessary for the energy budget were obtained from weather stations or IBM weather service, and from Corteva Agriscience proprietary Internet of Things (IoT) devices equipped with an infrared thermometer. This IoT device (Figure 2) was designed and manufactured in-house by the Corteva Agriscience Predictive Ag and Engineering teams.  The device measures the surface temperature, processes the data, and then sends 30-minute averaged values to a Corteva Agriscience-maintained cloud database using a cellular modem.
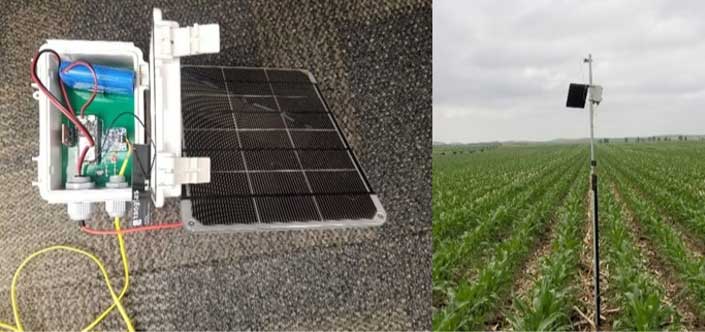
Photo - IoT device for measuring surface temperature (left) and the device deployed in a field (right).

Figure 2. IoT device for measuring surface temperature (left) and the device deployed in a field (right).

Studying Yield Gaps in Nebraska and Kansas

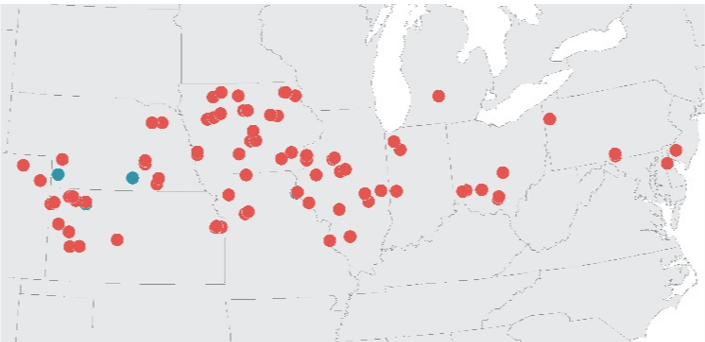
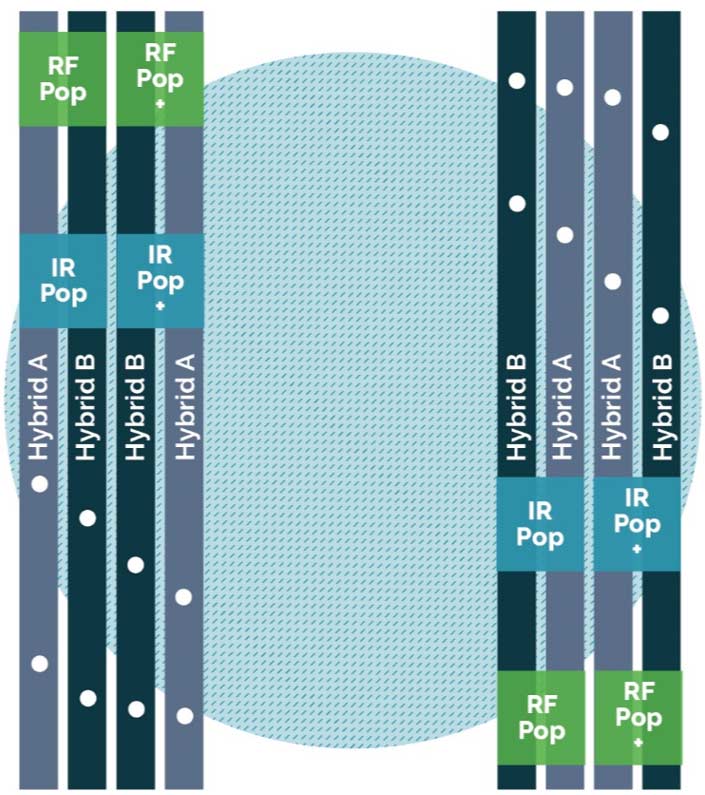
An on-farm experiment was conducted in 2019 and 2020 to evaluate the gap analyses framework by comparing observed yields for a given evapotranspiration level that maximizes productivity. In 2019, farms were in Webster County, NE, Chase County, NE, and Thomas County, KS (Figure 3). Two hybrids were planted under the irrigation system in the fields, with rainfed conditions in the corners of the fields with the center pivot. Each hybrid was planted at two different populations in the irrigated and rainfed areas of the field. Two replicates were planted at each location (Figure 4). Yield was estimated using the farmers’ combine yield monitors, and ET was estimated from sixteen ground-based IoT sensors deployed at each location using a modified surface renewal energy balance approach. Evapotranspiration was also measured at an additional location in Maynard, IA. With the help of 34 Pioneer Field Agronomists, who coordinated the efforts and deployed the IoT devices, the number of farmers’ fields was extended to 94 in 2020 throughout the U.S. Corn Belt (Figure 3).

Map - Gap analysis and ET measurement locations in North America, 2019 (blue) and 2020 (red).

Figure 3. Gap analysis and ET measurement locations in North America, 2019 (blue) and 2020 (red).

On-farm 2019 experiment design - rainfed and irrigated treatments with normal population and increased population for two hybrids.

Figure 4. On-farm 2019 experiment design, rainfed (RF) and irrigated (IR) treatments with normal population (Pop) and increased population (Pop+) for two hybrids. Sixteen IoT sensors (•) were placed for evapotranspiration measurements.

Optimizing Management to Close the Gap

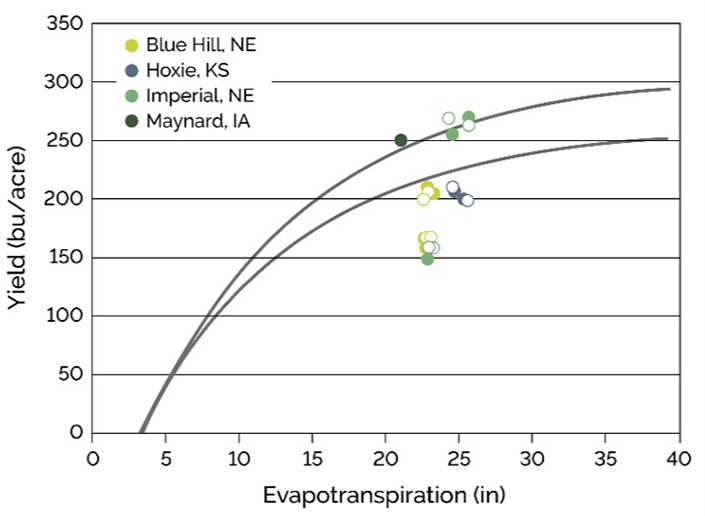
Figure 5 shows the observed yields for each location in the 2019 study and evapotranspiration pairs by environment for each location.

Graph - Theoretical corn yield response in 2019 to evapotranspiration for quantiles 80 and 99 percentiles (lines) and yield observations for four locations in the western U.S.

Figure 5. Theoretical corn yield response in 2019 to evapotranspiration for quantiles 80 and 99 percentiles (lines) and yield observations for four locations in the western U.S. Corn Belt for corn grown under rainfed and irrigated conditions, and under normal (closed symbols) and increased plant population by 1 plant m-2 (open symbols).

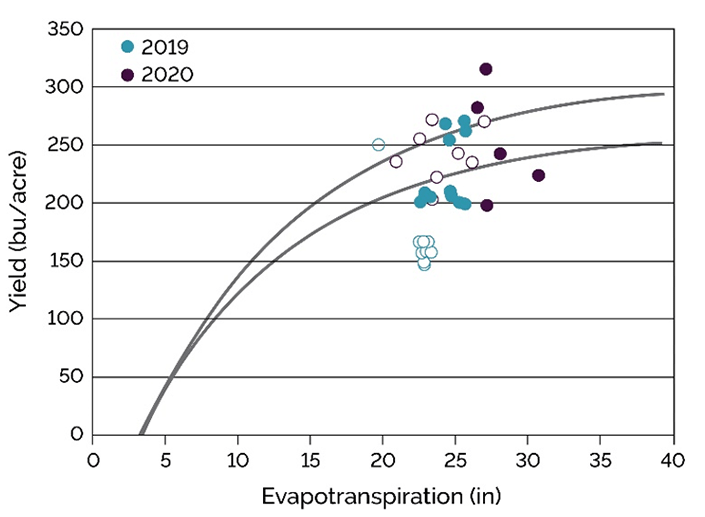
The curved lines, designating the quantiles 80 and 99 percentiles are shown to quantify yield gaps. The area defined by these curves represents the water-limited yield potential. Observed yields in that area indicate those fields had no yield gaps and therefore management was optimal. The maximum yield on the y-axis of the chart that can be obtained for the corresponding ET level on the x-axis of the chart should be between these two lines 80 to 99 percent of the time. The results demonstrate it is feasible to implement systems, using current technologies and hybrids, to improve and maximize water productivity. For example, the rainfed yield and evapotranspiration level at the Blue Hill, NE and Imperial, NE locations were very similar. However, minor differences in timing of irrigation for very similar ET levels led to a large productivity gap at the irrigated Blue Hill location when compared to the irrigated Imperial location. Hybrid and population variables included at these two locations had much less impact on the yield level that was achieved when comparing these two locations. Figure 6 shows the observed yields and evapotranspiration pairs for the 2020 locations that had been reported at the time of writing this article for 2020 along with the locations from the 2019 experiment.

Graph - Theoretical corn yield response to evapotranspiration for quantiles 80 and 99 percentiles (lines) and yield observations in the US corn belt for corn grown under rainfed (open symbols) and irrigated (closed symbols) conditions in 2019 and 2020.

Figure 6. Theoretical corn yield response to evapotranspiration for quantiles 80 and 99 percentiles (lines) and yield observations in the US corn belt for corn grown under rainfed (open symbols) and irrigated (closed symbols) conditions in 2019 and 2020.

Results show a high frequency of farms operating at or close to current water-limited potential yields. Also, there are many irrigated systems that can increase water productivity by reducing irrigation amounts without compromising productivity. Yield observations that fall below the 80 percent quantile suggest there are opportunities to improve product selection, nutrient management, and timing of irrigation.

This tool can create awareness for both the overuse of a water resource, that could be allocated to grow another crop, or the existence of a gap that can increase the returns per acre by improving the agronomic management and the expression of the genetic potential for the product. The intent of this modeling tool is to empower agronomists and farmers to simultaneously increase productivity and sustainability.

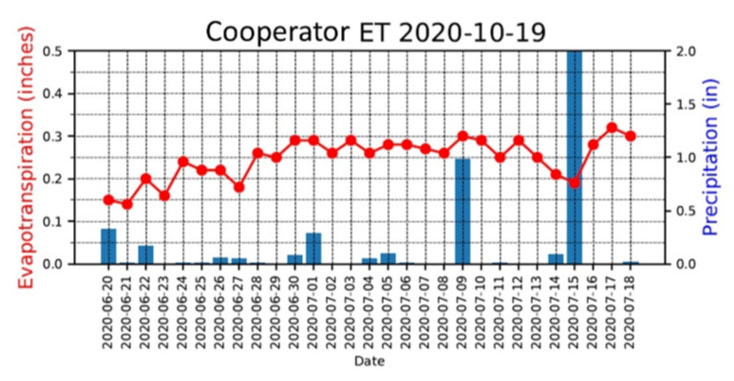
Chart - Example ET report with the ET (red) reported on the left and the recorded precipitation (blue) from IBM weather services reported on the right.

Figure 7. Example ET report with the ET (red) reported on the left and the recorded precipitation (blue) from IBM weather services reported on the right.

Summary

  • This project will enhance our knowledge about the ET trends for the select locations and as aggregated for various yield levels as well as contribute to crop model refinement used by Pioneer and Corteva Agriscience teams.
  • In addition to collecting ET data for end-of-year yield gap analysis, Field Agronomists were provided with ET reports to share with their cooperators (Figure 7).
  • The identification of gaps or overuse of water resources can create awareness of business opportunities to increase the productivity and sustainability of the farm operations.

Make Every Acre Count

Crop protection products from Corteva Agrisicence give you the power to fight weeds, diseases, insects and nematodes while keeping nitrogen in the root zone. Find the right crop protection technology to maximize your acres.

Explore Solutions

Contact your state pesticide regulatory agency to determine if a product is registered for sale or use in your area. Always read and follow label directions.


1Christopher Parry, Ph.D., Research Scientist
2Jose Rotundo, Ph.D., Research Scientist
3Dan Berning, Pioneer Agronomy Manager, Western Corn Belt
4Charlie Messina, Ph.D., Corteva Laureate


The foregoing is provided for informational use only. Please contact your Pioneer sales professional for information and suggestions specific to your operation. Product performance is variable and depends on many factors such as moisture and heat stress, soil type, management practices and environmental stress as well as disease and pest pressures. Individual results may vary.