12/13/2020

Research Shows New Nutrient Sufficiency Ranges for High Yield Crops

Something went wrong. Please try again later...

Key Points

  • Tissue sampling measures key nutrients critical to crop growth and development. However, the industry has lacked clear guidelines on nutrient sufficiency levels for high-yielding crops, so use of tissue sampling has been limited.
  • Pioneer’s multi-year research showed that nutrient levels differed significantly by yield level in both corn and soybeans, with higher yielding crops having higher total nutrient concentrations.
  • Analysis showed that some nutrients are more critical to yield than others, and more is not always better. Some nutrients showed a peak or plateau in yield response.
  • Pioneer’s identified sufficiency ranges for some nutrients were substantially higher than previously published ranges.
  • With these defined sufficiency values, growers can likely use tissue sampling to evaluate inputs based on the ability to reach these values, even in the absence of yield.

Why Use Tissue Sampling in Crop Production

  • Plant tissue analysis, or tissue sampling, involves testing a sample of tissue from a growing plant to quantify nutrient levels in the tissue.
  • In crop production, the goal is to determine if nutrient levels are sufficient to maximize yield.
  • Plant nutrient deficiency symptoms indicate that the crop did not or is not receiving adequate nutrients.
  • However, the crop has undergone stress by the time visual deficiencies appear, and application of nutrients following the appearance of deficiency symptoms may not fully recover yield.
  • Tissue testing provides an opportunity to measure nutrient levels before the crop shows visual symptoms of deficiency.

The National Corn Growers Association National Corn Yield Contest and other yield contests have shown the remarkable yields that can be achieved with modern hybrids and varieties when resources are non-limiting. As farmers participate in yield contests and work to incrementally boost yields, it becomes increasingly important to understand nutrient levels needed for maximizing crop yields and nutrient management programs necessary to achieve those levels.

Tissue sampling for comparison across yield levels can provide insight into correlations that exist between tissue sample nutrient levels and yield. A defined set of tissue sample ranges for different yield levels could also potentially guide crop management for greater yields.

Photo - Closeup - corn plants in field - early summer.

Improving the Value of Tissue Sampling

Tissue sampling can be utilized in many ways, including problem diagnosis, nutrient program monitoring, or in-season nutrient management. However, adoption of tissue sampling as a routine crop management practice has been limited for several reasons, including cost and workload, variability of results, perceived lack of correlation between nutrient concentrations and crop performance, and the lack of clear guidelines on nutrient sufficiency levels for high-yielding crops as well as actions that can be taken to achieve those levels. 

Many published sufficiency ranges are based upon a frequency distribution; i.e., the optimal nutrient range corresponds with the most frequently observed levels. Other ranges are based on fertilizer amendment studies, growth reduction levels, or fewer still on antiquated, lower yield levels. 

Pioneer Tissue Sampling Research

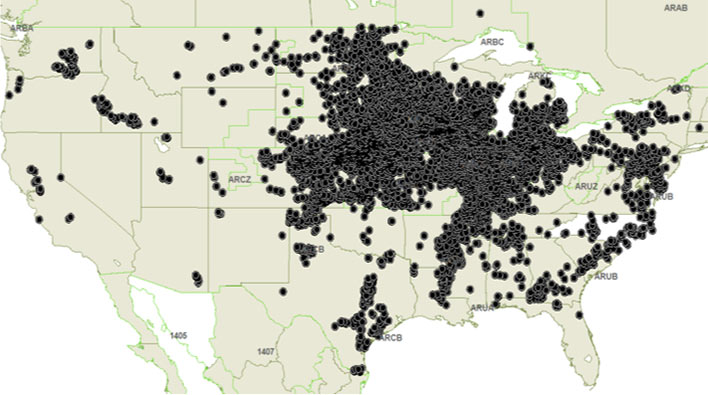
Pioneer agronomists conducted a multi-year study in which plant tissue samples were collected from select corn and soybean on-farm trials to explore the relationships between plant nutrient levels during the growing season and yield. The goals of this study were to characterize correlations between corn and soybean yield and plant nutrient levels at key growth stages and to use data from the highest-yielding locations to create recommended nutrient sufficiency ranges for maximum yield.

Map - Pioneer on-farm trial locations in the U.S. and Canada 2017-2019.

Figure 1. Pioneer on-farm trial locations in the U.S. and Canada 2017-2019.

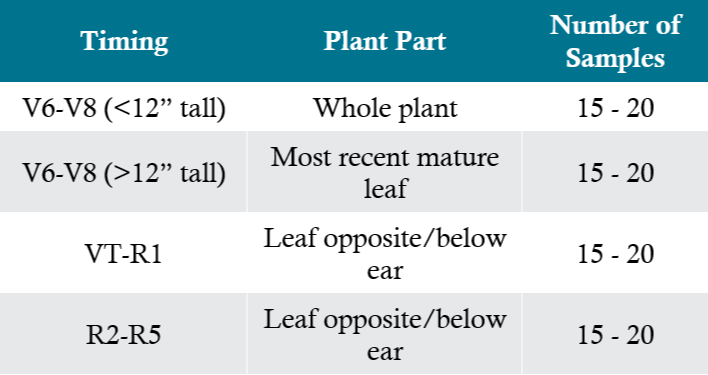
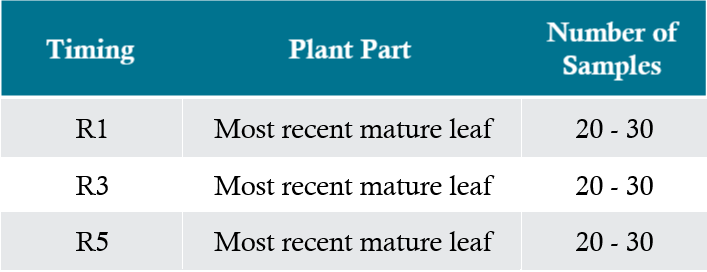
Tissue samples were collected from a select subset (550 corn, 467 soybean) of the nearly 12,000 on-farm trials that Pioneer agronomists conduct annually in the U.S. and Canada (Figure 1). Tissue samples were collected at three different timings in corn (V6, VT/R1, R3) and soybeans (R1, R3, R5) during the growing season (Table 1 and Table 2). These growth stages relate to different physiological events and represent key periods in yield determination. Tissue samples were sent to Waypoint Analytical for nutrient quantification. Yields were recorded at harvest.

Table 1. Plant tissue sampling procedures for corn.

Table - Plant tissue sampling procedures for corn.

Table 2. Plant tissue sampling procedures for soybeans.

Table - Plant tissue sampling procedures for soybeans.

Data Analysis

Tissue sample data were collected from Pioneer on-farm trials over multiple years. Soybean trials were sampled in 2017, 2018, 2019, and 2020, and corn trials in 2018, 2019, and 2020. Regression analyses were conducted to explore relationships between corn and soybean yield and nutrient levels at key growth stages during the season. Correlation coefficients for significant relationships were quantified and the simplest relationship with similar correlation coefficients was chosen. Correlation coefficients were then used to rank the effect of nutrients on yield.

Sampling locations were assigned to one of four categories based on yield level:

  1. Maximum yield ( > 1 std. dev. above the mean)
  2. High yield ( < 1 std. dev. above the mean)
  3. Below average ( < 1 std. dev. below the mean)
  4. Low yield ( > 1 std. dev. below the mean)

Nutrient sufficiency ranges were created based on nutrients levels measured at locations in the maximum yield category for both corn and soybean. Maximum yield locations ranged from 270-474 bu/acre in corn and 86-123 bu/acre in soybeans. These ranges (and means) were compared to commonly published sufficiency ranges.

Results: Published Nutrient Sufficiency Ranges May Not Be Adequate

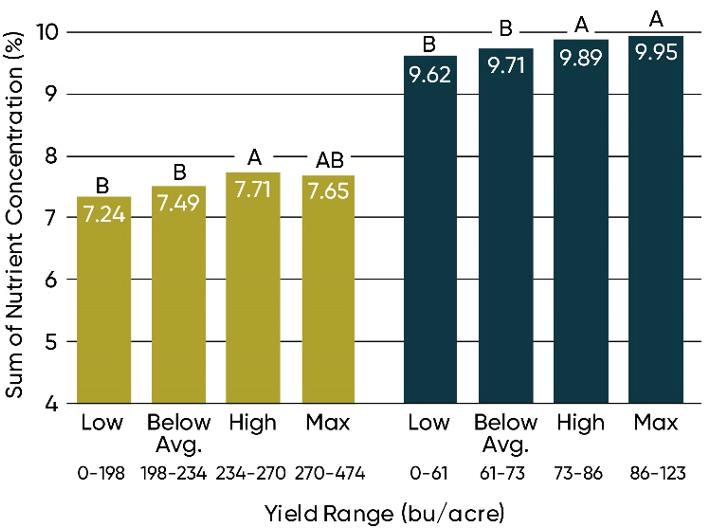
Results showed that higher yielding crops generally had higher overall nutrient levels than lower yielding crops. Nutrient levels differed significantly among yield level categories for both corn and soybeans (Figure 2).

Chart - Mean comparison of sum total of measured nutrient tissue concentrations across four yield levels in corn and soybean.

Figure 2. Mean comparison of sum total of measured nutrient tissue concentrations across four yield levels in corn and soybean. Sum of nutrient concentration is equal to % N+P+S+K+Mg+Ca+Na+Fe+Mn+Zn+Cu+B+Mo+Al.
Values with the same letter within a crop are not significantly different.

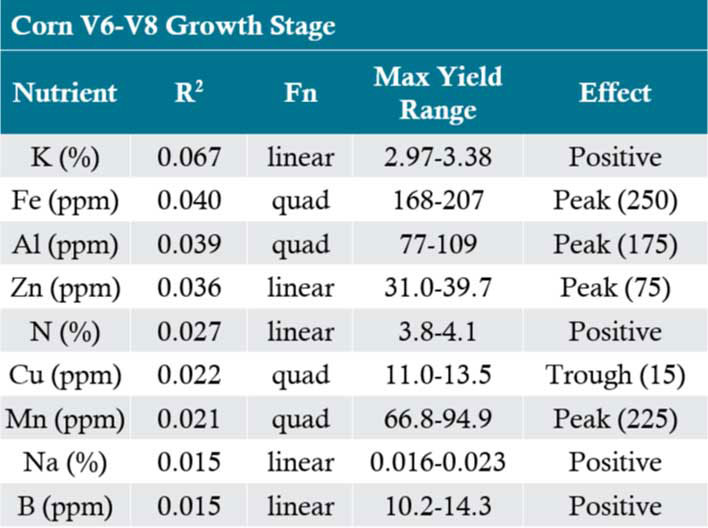
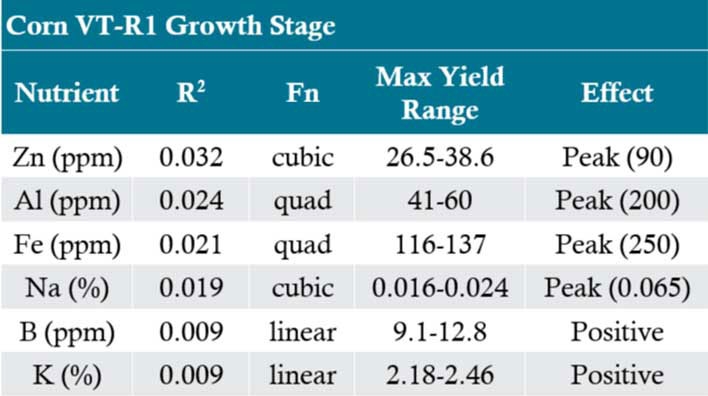
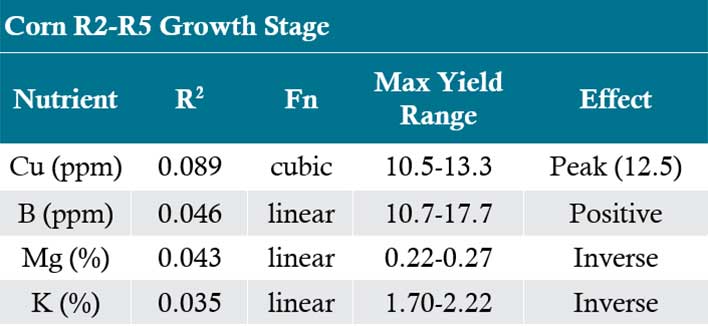
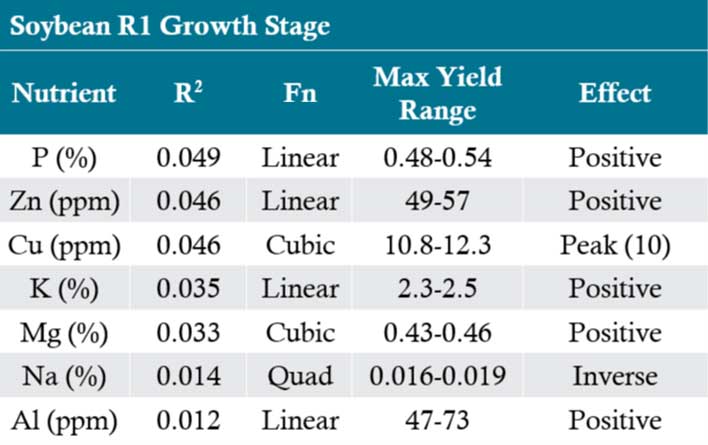
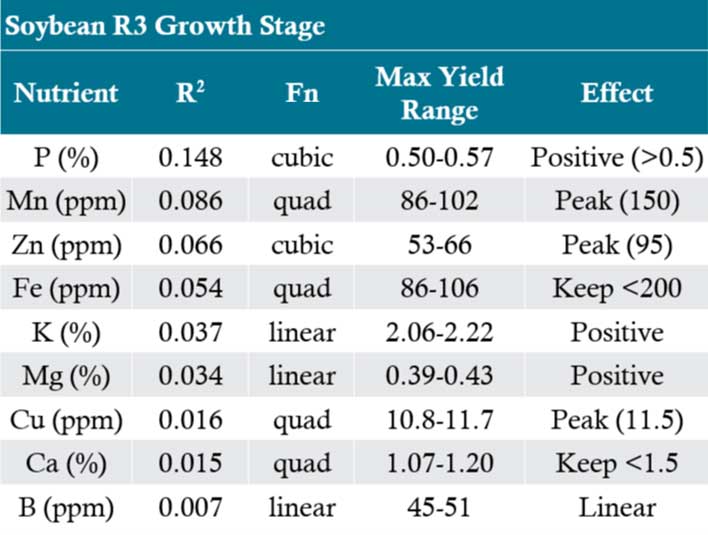
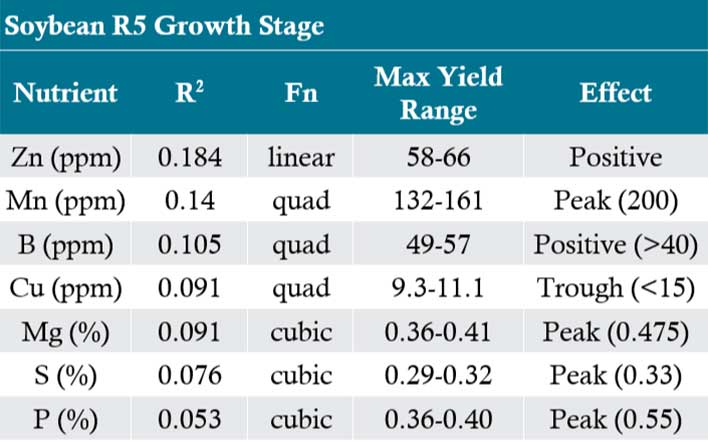
Analysis of yield correlation to individual nutrients showed many significant relationships. There were correlations between nutrient levels and yield for both corn and soybean (Table 3 and Table 4). Tissue concentration ranges for maximum yield, as well as descriptions of the correlations (effect) are shown. The characteristics of correlations between yield and concentrations of individual nutrients suggested by the analysis varied:

  • Positive – Yield increase with higher concentration
  • Inverse – Yield decrease with higher concentration
  • Peak – Yield is maximized at a specific level (shown in parentheses)
  • Trough – Yield was greater at the top and bottom of the range

In general, more nutrients were critical in early stages of the corn crop; whereas in soybean, many nutrients were critical season-long. Overlap among key nutrients existed across the two crops. Some relationships were positive, some were inverse, others indicated a peak or plateau in yield response to nutrient level.

Table 3. Nutrient tissue sample value statistics for relationship to yield in corn by growth stage. Nutrients are ranked by correlation coefficient (R2). Only those nutrients with a Pr>F <0.10 were included.

Table - Nutrient tissue sample value statistics for relationship to yield in corn by growth stage (V8-V6).

Table - Nutrient tissue sample value statistics for relationship to yield in corn by growth stage (VT-R1).

Table - Nutrient tissue sample value statistics for relationship to yield in corn by growth stage.

Table 4. Nutrient tissue sample value statistics for relationship to yield in soybean by growth stage. Nutrients are ranked by correlation coefficient (R2). Only those nutrients with a Pr>F <0.10 were included.

Table - Nutrient tissue sample value statistics for relationship to yield in soybean by growth stage.

Table - Nutrient tissue sample value statistics for relationship to yield in soybean by growth stage.

Table - Nutrient tissue sample value statistics for relationship to yield in soybean by growth stage.

Table - Nutrient tissue sample value statistics for relationship to yield in soybean by growth stage.

Nutrient sufficiency ranges generated based on samples taken at maximum yield locations (>270 bu/acre in corn and >86 bu/acre in soybeans) were slightly or substantially higher than previously published ranges in many cases.

Sufficiency ranges for N and K during vegetative stages in corn were substantially higher than previously published ranges (Table 5). Numerous other nutrients had ranges that were slightly higher or narrower than published ranges at one or more growth stages. Sufficiency ranges for many nutrients were identified to be at the lower end of the published ranges. In six of the nutrient x growth stage combinations, luxury feeding is likely occurring. In four of the nutrient x growth stage combinations, the published range for the nutrient could be deleterious to yield.

Table 5. Nutrient tissue sufficiency ranges for maximum yield corn at critical growth stages. Colors indicate differences from previously published nutrient sufficiency ranges.
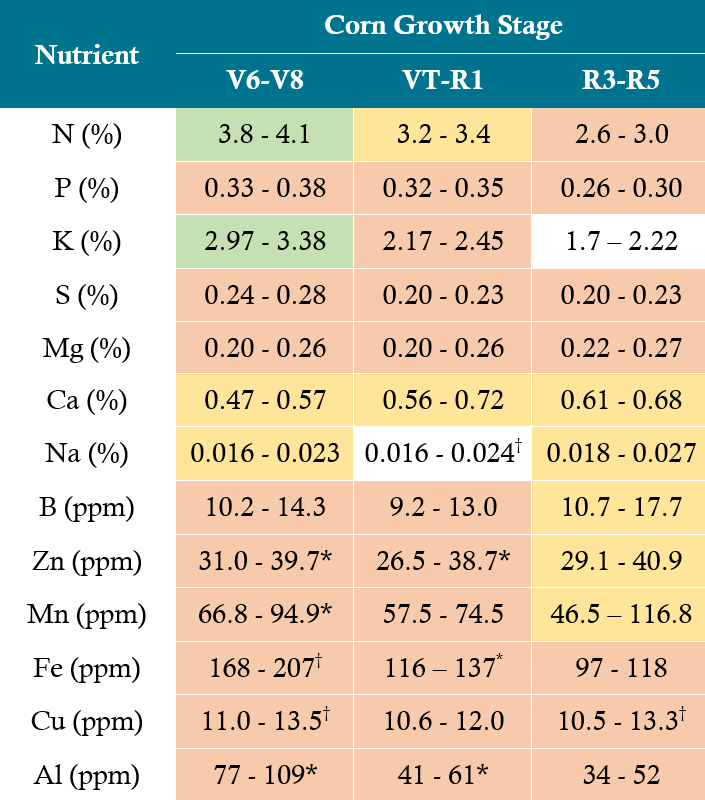
Table - Nutrient tissue sufficiency ranges for maximum yield corn at critical growth stages.

Legend

* Data indicate a peak in yield relative to nutrient level, suggestive of luxury feeding at high levels. If level is above this range, consult your Pioneer agronomist for specific recommendations.

Data indicate a decrease in yield relative to nutrient level beyond a certain point, suggestive of possible toxicity at high levels or antagonistic nutrient interaction. If level is above this range, consult your Pioneer agronomist for specific recommendations.
 

Photo - Closeup - plant in field.

In soybean, N sufficiency ranges were higher than published ranges at two of the three critical growth stages (Table 6). Ranges for P, K, Ca, Zn, and Mn were also greater than published ranges at one or more growth stages. Yet again, many nutrient sufficiency ranges were found to be at the lower end of published ranges. Fourteen combinations of nutrient x growth stage existed where yield would suffer from published ranges in this data set; three cases of luxury feeding existed.

Table 6. Nutrient tissue sufficiency ranges for maximum yield soybeans at critical growth stages. Colors indicate differences from previously published nutrient sufficiency ranges.
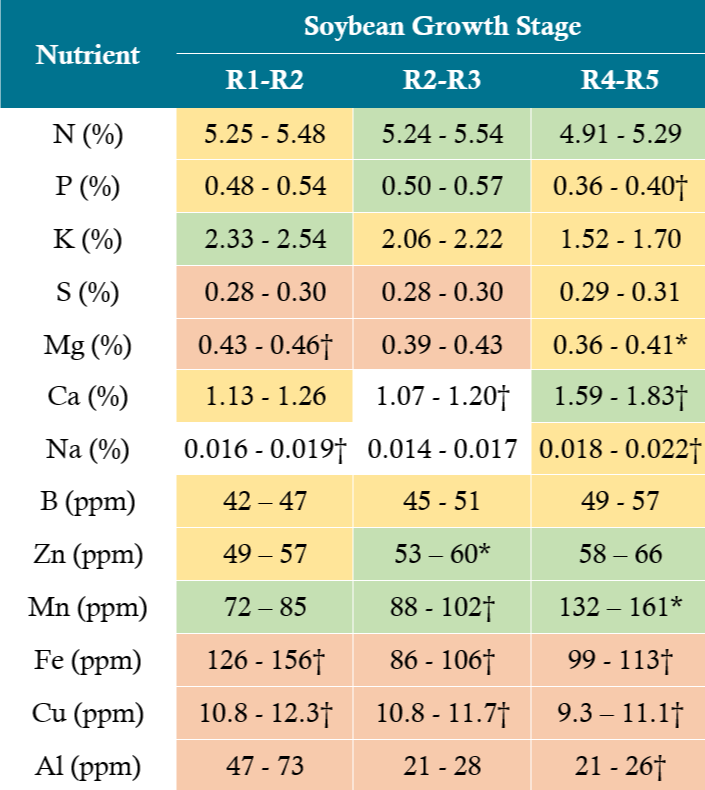
Table - Nutrient tissue sufficiency ranges for maximum yield soybeans at critical growth stages.

Range narrows in low end of published ranges.
Range narrows in high end of published ranges.
Range extends beyond published nutrient sufficiency ranges

Legend

* Data indicate a peak in yield relative to nutrient level, suggestive of luxury feeding at high levels. If level is above this range, consult your Pioneer agronomist for specific recommendations.

Data indicate a decrease in yield relative to nutrient level beyond a certain point, suggestive of possible toxicity at high levels or antagonistic nutrient interaction. If level is above this range, consult your Pioneer agronomist for specific recommendations.

These ranges should be used to carefully monitor a cropping system. Table 3 and Table 4 provide insight as to the most important nutrients within this high yield data set; Table 5 and Table 6 provide ranges and relationships. In some instances, a clear direction to address a need may not be evident. For example, Cu levels may be higher than you would like based on this dataset. Investigation will find that Cu can compete with Mn for uptake. A management change to combat the higher Cu level may be proper placement of Mn. A thorough understanding of nutrient uptake and interactions will likely be key to finding the most economical, convenient, and reliable amelioration efforts.
Next Steps

Pioneer is continuing its research into nutrient management practices for maximizing corn and soybean yields, including further analysis into data collected from 2017 to 2020. Insights from these analyses will inform further research projects. Areas of focus for next steps include:

  1. Analysis to explore nutrient ratios at high yield levels
  2. Development of nutrient application recommendations that account for both nutrient sufficiency levels and greater biomass accumulation at high yield levels
  3. Application of tissue sampling and biomass measures to evaluate effects of nutrient management practices.

Conclusions

Results from the multi-year tissue sampling study conducted by Pioneer agronomists showed that tissue nutrient concentrations are different at higher yield levels than lower yield levels and different in many cases from existing published values. Some nutrients are more critical to yield than others, and more is not always better. Crop producers should pay especially close attention to nutrients that showed a peak or plateau in yield response or that declined in concentration at higher yield levels.

Nutrient management programs for extremely high-yielding crops need to account for  higher tissue sample nutrient values as well as the greater total biomass produced at higher yield levels. Improving nutrient availability in the soil and uptake by the plants, using practices such as biologicals or fertilizer placement, will be critical in continuing to drive yields upward. Ongoing research to elucidate relationships or ratios of nutrients at key timings will help drive more efficient and environmentally friendly management practices.

Yield is a complex equation with many parts. With clearly defined sufficiency values, growers and advisors can likely use tissue sampling to evaluate inputs based on the ability to reach these values, even in the absence of yield. The next steps in this research effort will focus on biomass accumulation and its relationship to yield level as well as genetic/hybrid interactions in nutrient management.


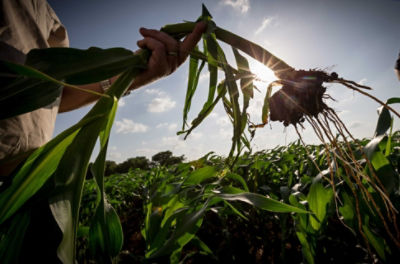
Testing corn plant roots - in field

Max In. Max Out.

Get the Max From Your Nitrogen

As soon as you apply nitrogen to the soil, it's vulnerable to loss. Nitrogen stabilizers from Corteva Agriscience deliver unrivaled technology to help you protect any nitrogen source.

See Solutions

Instinct NXTGEN® is not registered for sale or use in all states. Contact your state pesticide regulatory agency to determine if a product is registered for sale or use in your state. Always read and follow label directions. Do not fall-apply anhydrous ammonia south of Highway 16 in the state of Illinois.


The foregoing is provided for informational use only. Please contact your Pioneer sales professional for information and suggestions specific to your operation. Product performance is variable and depends on many factors such as moisture and heat stress, soil type, management practices and environmental stress as well as disease and pest pressures. Individual results may vary.