Key Findings

  • This study showed a genetic gain of 0.57 bu/acre/year for soybean varieties released between 1980 and 2013.
  • The primary driver of genetic yield gain was increased seed set per unit area.
  • High-rate nitrogen fertilizer increased yield by an average of 7.9 bu/acre, primarily due to increased seed weight.
  • Soybean yield response to added nitrogen fertilizer did not differ by year of variety commercial release. 

Rationale and Objectives

  • A two-year field study was conducted to quantify yield improvement for soybean using a set of seven Pioneer® brand soybean varieties commercially released over a 33-year period (1980-2013). 
  • Soybean varieties were grown with no nitrogen fertilization and with high nitrogen fertilization (500 lbs/acre) to compare effects on yield components, particularly seed weight.
  • This research was conducted by Santiago Tamagno and Dr. Ignacio A. Ciampitti at Kansas State University as a part of the Pioneer Crop Management Research Awards (CMRA) Program. 

Study Description

  • Years: 2016, 2017
  • Location: Kansas River Valley Research Station, Rossville, KS
    Soil test: 21 ppm P (Mehlich, 6-inch depth), 158 ppm K (6-inch depth), 3 ppm N (24-inch depth)
  • Planting Date: May 12 (2016), May 18 (2017)
  • Plot Size: 10 x 50 ft
  • Row Spacing: 30 inches  
  • Experimental Design: Split-plot
  • Nitrogen Fertilization (Main Plot Factor):
    • 0 lbs N/acre (Zero N)
    • 500 lbs N/acre (High N) – applied as UAN (28-0-0), ⅓ at planting, ⅓ at R1, ⅓ at R3
  • Variety/Brand1 (Sub-Plot Factor) and Year of Release:
    • P3981 - 1980
    • 9391 - 1987
    • 9392 - 1991
    • 93B82 - 1997
    • 93B67 (R) - 2001
    • 93M90 (R) - 2003
    • P35T58R (R) - 2013

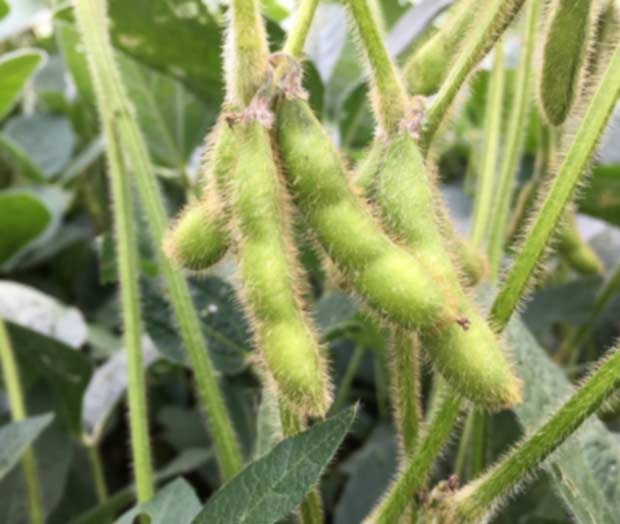
Photo - Soybeans in pod.

  • Data Collection and Analysis:
    • The two center rows in each plot were harvested with a plot combine for yield.
    • Seed weight was measured from a 1000 seed subsample.
    • Seeds were sampled in all plots at R5 weekly until harvest maturity in order to characterize the seed-filling curve and estimate final seed weight.
    • At each sampling time, plants were removed to use the stem fraction to measure ureide and nitrate concentration using the hot water extraction method, following Hungria and Araujo (1994).
    • Both concentrations were used to calculate the relative abundance of ureides as a parameter to estimate biological nitrogen fixation throughout the seed filling period.
    • The percentage of biological nitrogen fixation was quantified using established calibrations from Unkovich et al. (2008). A quadratic function was fitted to characterize the dynamics during the seed filling period.

Results

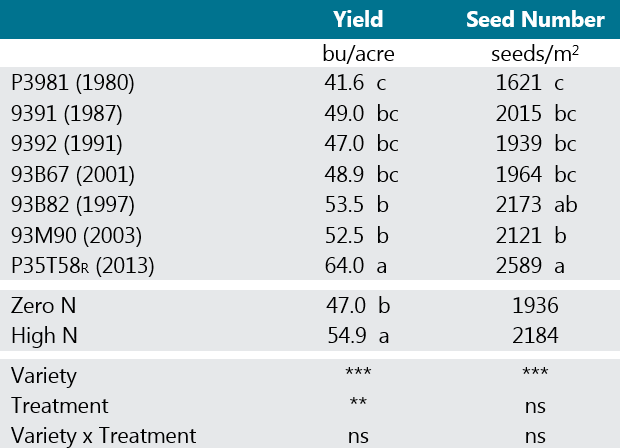
  • Soybean yield (bu/acre) was significantly influenced by soybean variety and nitrogen treatment (Table 1).
  • Seed number (seeds/m2) significantly differed among varieties.
  • Nitrogen fertilization increased soybean yield by an average of 7.9 bu/acre. The yield effect of nitrogen fertilization did not differ among soybean varieties.

Table 1. Soybean variety and nitrogen treatment effects on soybean yield and seed number.

Table - Soybean variety and nitrogen treatment effects on soybean yield and seed number.

*, **, *** Significant at the 0.05, 0.01 and 0.001 probability level respectively. ns: not significant. Means followed by the same letter are not significantly different based on Tukey (P < 0.05).

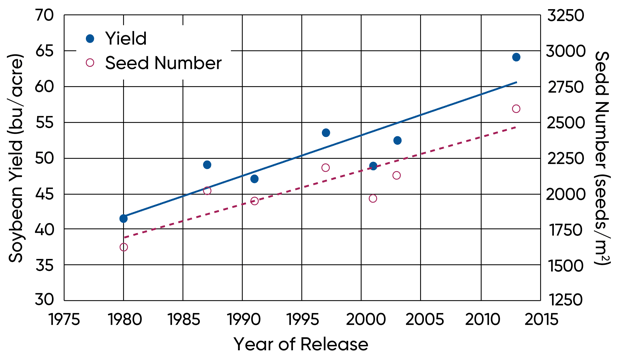
  • Soybean yield increased with year of variety commercial release by an average of 0.57 bu/acre/year (Figure 1).
  • Average seed number increased with year of variety commercial release as well, indicating that genetic yield gain was driven in large part by a greater number of seeds per unit area.

Graph - Yield and seed number of soybean varieties by year of commercial release.

Figure 1. Yield and seed number of soybean varieties by year of commercial release.

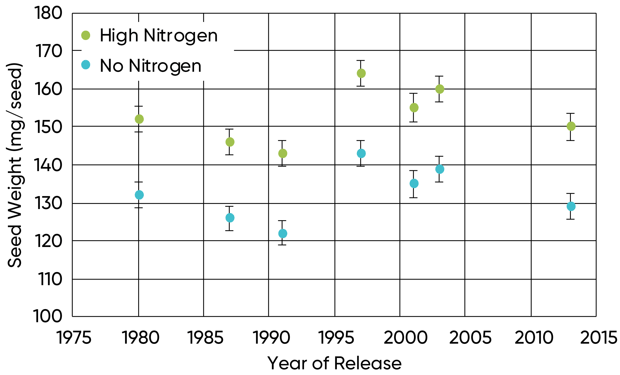
  • Seed weight significantly differed among soybean varieties and nitrogen treatments (Figure 2).
  • The high nitrogen fertilizer treatment significantly increased average seed weight for all soybean varieties compared to no nitrogen treatment.
  • Seed weight did not show any relationship with the year of variety commercial release; hence, for the varieties used in this study, genetic yield gain can be fully attributed to increases in seed set per area.
  • Results did not indicate a tradeoff between seed number and seed weight associated with genetic gain – newer varieties were able to set more seed per acre while maintaining seed weight.
  • While seed weight showed differences among varieties and treatment, its contribution to the overall yield was lower compared with the seed number.

Chart - Final seed weight and standard errors for soybean varieties by year of commercial release with and without added nitrogen fertilizer.

Figure 2. Final seed weight and standard errors for soybean varieties by year of commercial release with and without added nitrogen fertilizer.

  • There were no interactions or differences between soybean varieties for biological nitrogen fixation dynamics, meaning that genetic gain did not introduce differences in this process (data not shown).
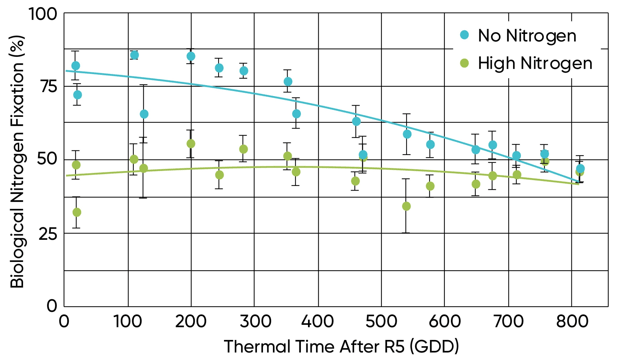
  • The percentage of biological nitrogen fixation at the beginning of the seed filling period was significantly higher in the control compared with the high nitrogen treatment (Figure 3).
  • The magnitude of this response can be attributed to the effect of the nitrates in the soil originated from fertilizer applications which inhibited the activity in the nodules.
  • Even though biological nitrogen fixation is typically the main source of nitrogen during the seed filling period, the nitrogen supplied by the fertilizer application was enough to maintain photosynthesis levels to supply photoassimilates to the seeds and increase seed weights.

Chart - Changes in proportion of biological nitrogen fixation during the seed filling period with and without added nitrogen fertilizer.

Figure 3. Changes in proportion of biological nitrogen fixation during the seed filling period with and without added nitrogen fertilizer. Each data points is the average for each year.

References

  • Hungria, M., Araujo, R.S., 1994. Manual de métodos empregados em estudos de microbiologia agrícola. Embrapa-Serviço de Produção e Informação, Brasilia, Brazil.
  • Unkovich, M., Herridge, D.F., Peoples, M., Cadisch, G., Boddey, B., Giller, K., Alves, B., Chalk, P., 2008. Measuring plant-associated Nitrogen fixation in agricultural systems. ACIAR Monograph No. 136.


Authors: Santiago Tamagno and Dr. Ignacio A. Ciampitti; Department of Agronomy, Kansas State University

April 2020

Glyphosate tolerant

The foregoing is provided for informational use only. Please contact your Pioneer sales professional for information and suggestions specific to your operation. 2016-2017 data are based on average of all comparisons made in one location through December 1, 2017. Multi-year and multi-location is a better predictor of future performance. Do not use these or any other data from a limited number of trials as a significant factor in product selection. Product responses are variable and subject to a variety of environmental, disease, and pest pressures. Individual results may vary. Pioneer® brand products are provided subject to the terms and conditions of purchase which are part of the labeling and purchase documents. Varieties with the Glyphosate Tolerant trait (including those designated by the letter “R” in the product number) contain genes that confer tolerance to glyphosate herbicides. Glyphosate herbicides will kill crops that are not tolerant to glyphosate. ¹All Pioneer products are varieties unless designated with LL, in which case some are brands.